
Create a Dashboard
A dashboard is a set of charts displayed in a dedicated workspace. The key feature of a dashboard is that all charts on it can be managed in a consistent manner. This means that a custom filter can be created on a dashboard and applied to all the charts on it at a time, e.g., like this.
Create an Empty Dashboard
On the Dashboards page on Apache Superset home screen, click +Dashboard to enter the new dashboard name (e.g., "IREX demo") and click Save. The new dashboard name will then appear on the dashboard list.
Add Charts to the Dashboard
- Click the dashboard name on the list to open the dashboard, then click Edit dashboard - the list of previously created charts appears on the sidebar on the right.
- Drag and drop the charts to add to the dashboard as shown.
.webp)
Manage Charts on the Dashboard
Consider an example, in which we will build a filter on a dashboard applicable to all the charts on it at a time. The filter will allow the selection of cameras that supply the data for the charts.
- On the dashboard, click as shown to open the Filters sidebar on the left.
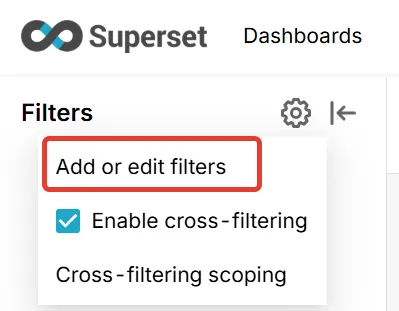
- Under the Filters, click Add or edit filters.
- On the Add filter screen, enter the name of the filter (e.g., "By channel").
- Since the ID of a camera is in the channel_id column, select it under Column and click Save.
- On the Filters sidebar, select the camera IDs to show on the chart and click Apply filters - all charts on the dashboard will be redrawn accordingly.
.webp)
.webp)
.webp)